Decoding Earth's Story: A Beginner's Guide to Reading a Seismograph
Ever felt a tremor and wondered what it looked like on paper? Let's pull back the curtain on seismograms and learn to read the secret language of our planet, one squiggle at a time.
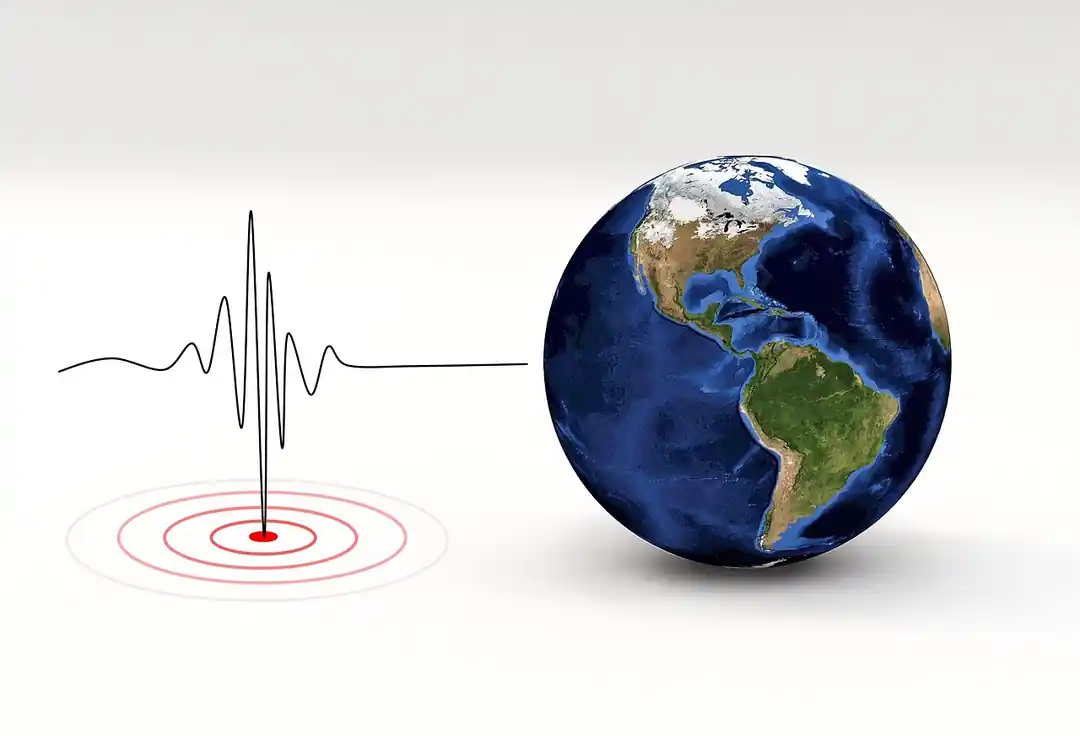
Have you ever felt a faint rumble under your feet and immediately jumped online to see if it was an earthquake? I know I have. There’s a certain thrill, a mix of awe and apprehension, that comes with realizing the ground beneath us isn't as solid as we think. When you look up that event, you’re often greeted by a seismogram—a series of jagged, squiggly lines that, for most of us, might as well be a secret code.
For the longest time, I saw those charts as something only scientists in white lab coats could understand. But honestly, the basics are surprisingly accessible. Learning to read a seismogram is like learning the alphabet of geology. It transforms a confusing jumble into a fascinating narrative about our planet's power and mechanics. It’s not just about understanding earthquakes; it’s about appreciating the dynamic, living world we inhabit.
So, let's demystify it together. We're going to break down how to read a seismogram—the actual recording—which is made by a seismograph. Think of the seismograph as the writer and the seismogram as the story it writes. This story is a simple graph of ground motion over time, and by the end of this, you'll be able to read its key plot points.
The Anatomy of a Seismogram
Before we get into the exciting parts—the waves—we have to understand the page the story is written on. A seismogram has two primary axes. The horizontal axis (the x-axis) represents time, usually marked in seconds or minutes. As you read from left to right, you're moving forward in time. It’s a continuous timeline of the ground's activity.
The vertical axis (the y-axis) measures amplitude. This is just a fancy word for the intensity of the ground shaking. A flat line means the ground is still (mostly). The higher the peaks and the lower the troughs of the squiggles, the more the ground moved up and down or side to side. During a seismic event, these squiggles, which represent seismic waves, are what we’re interested in. They are the characters in our story.
The Main Characters: P-waves, S-waves, and Surface Waves
An earthquake doesn't just send out one type of shockwave; it releases several, all traveling at different speeds. Reading a seismogram is mostly about identifying these different waves. There are three main types you need to know: P-waves, S-waves, and Surface waves.
First to arrive are the P-waves, or Primary waves. They are the fastest seismic waves, so they'll always be the first signal you see on the seismogram after the flat line. P-waves are compressional, meaning they push and pull the rock in the same direction the wave is traveling, kind of like a Slinky. On the graph, they often appear as a series of smaller, quicker vibrations. I like to think of them as the opening act—not the main event, but a clear sign that something bigger is on its way.
Next on the scene are the S-waves, or Secondary waves. They travel slower than P-waves, so they arrive second. S-waves are shear waves, moving the ground perpendicular to the direction of travel (imagine shaking a rope up and down). This motion is more destructive than the push-pull of P-waves, so their signature on the seismogram is usually a series of larger, more dramatic wiggles. The appearance of these bigger waves is your cue that you're seeing the S-wave arrival. A fascinating fact I learned from the U.S. Geological Survey is that S-waves can only travel through solids, which is how scientists confirmed that Earth has a liquid outer core—S-waves can't pass through it!
The final, and often most dramatic, arrivals are the Surface waves. As their name suggests, they travel along the Earth's surface rather than through its interior. They are the slowest of the bunch but are almost always the largest in amplitude. These are the waves that cause the most shaking and the majority of the damage during an earthquake. On the seismogram, they look like long, rolling waves with high peaks and low troughs that can continue for some time. When you see these, you're seeing the most powerful part of the earthquake's signature.
Putting It All Together: Finding the Epicenter
So, how do scientists use this information? One of the most brilliant applications is locating an earthquake's epicenter. This is done by looking at the time difference between the P-wave and S-wave arrivals, known as the S-P interval.
Because P-waves are faster than S-waves, the gap between their arrival times increases with distance from the earthquake. Think of it like watching a thunderstorm: you see the lightning (the P-wave) before you hear the thunder (the S-wave). The longer the delay between the two, the farther away the storm is. Seismologists use this exact principle.
By measuring the S-P interval on a seismogram, a scientist can determine the distance to the epicenter from that specific recording station. But distance alone isn't enough—that only tells you the radius of a circle. To pinpoint the exact location, you need data from at least three different seismograph stations. By drawing a circle around each station with the calculated distance as the radius, the point where all three circles intersect is the earthquake's epicenter. It’s a beautiful and simple use of geometry to solve a massive puzzle.
It’s truly amazing what you can learn from a few squiggly lines. What once seemed like noise becomes a detailed account of an event that happened miles away, deep within the Earth. It’s a testament to human curiosity and our ability to find patterns in the chaos. The next time you feel the ground tremble, I hope you’ll look at the resulting seismogram not with confusion, but with a newfound sense of wonder for the powerful, living planet right under our feet.
You might also like

A Race to the Clouds: A Historical Guide to the World's Tallest Buildings
From Chicago's first skyscraper to Dubai's modern marvels, the title of the world's tallest building has traveled the globe. Let's explore the cities that have reached for the sky.

More Than Just a Label: The Real-World Benefits of an Energy-Efficient Home
We've all seen the ENERGY STAR stickers, but what do they really mean for your wallet and your lifestyle? It turns out, the benefits go way beyond just saving a few bucks.

Your Ultimate Packing Guide for a Florida Space Coast Adventure
Dreaming of rocket launches and sun-kissed beaches? Here's everything you need to pack for an unforgettable trip to Florida's Space Coast.

Cathedrals of Sport: The Architectural DNA of the Modern Stadium
Ever wonder what goes into building the colossal stadiums of today? It's more than just seats and a field. We're diving into the architectural marvels that make modern venues a world away from the bleachers of the past.

The Solo Female Traveler's Guide to Morocco: A Deep Dive into Safety
Dreaming of a solo trip to Morocco? It's a question I get asked all the time. Let's walk through the realities, the precautions, and the absolute magic of exploring this country on your own.